SEEK job ads decline by 4.7% but salaries up across all states
|
STATE OF THE NATION:
STATE OF THE STATES:
|
STATE OF THE NATION: PUBLIC SERVICE ROLES CONTINUE TO PERFORM
The latest SEEK Employment Report showed a decline of 4.7% in jobs advertised compared to March 2018. Whereas, the average advertised salary across Australia rose 2.6% year on year.
Kendra Banks, Managing Director, SEEK ANZ comments: “Although year on year job ad growth declined this month, job ads continue to be at a relatively high level and the softening we are seeing in growth is mirrored by softening in GDP growth numbers. A majority of the states and territories experienced this decline, to the exclusion of Tasmania (+15.5%) and Western Australia (+2.7%).”
“In our larger labour force states, such as Victoria and NSW there is a continued job ad decline (-3.1% and -9.0% respectively), with NSW declining since the beginning of the first quarter in 2019. Part of the decline in NSW may reflect a more cautious approach by businesses leading up to the recent state election.”
Job ad growth in industries related to public service continues to outperform other sectors. This includes Government & Defence (+16.8%), Healthcare & Medical (+6.4%), Education & Training (+5.8%) and Community Services & Development (+4.4%), reflecting the current role of government in supporting activity.
Table 1: Top five industries with the highest job ad growth.
|
INDUSTRY |
PERCENTAGE GROWTH (Y/Y MARCH 2019) |
|
Government & Defence |
16.8% |
|
Healthcare & Medical |
6.4% |
|
Education & Training |
5.8% |
|
Community Services & Development |
4.4% |
|
Mining, Resources & Energy |
1.4% |
While the Mining, Resources & Energy (+1.4%) sector still experienced an increase in job ads, compared to previous years, this was a modest growth.
The month also saw a decline in job ads across the housing sector, alongside the weakening housing market, particularly with Design & Architecture (-26.4%), Real Estate & Property (-20.5%) and Construction (-19.8%).
Kendra comments on the housing trend, “Our data has helped us to identify that regional areas outside of the greater capital cities appear to be less susceptible to the downturn in the housing market, which in the larger cities impacts sectors such as construction and trades.”
Despite the slowdown in job ads, the average advertised salary across Australia in March was up +2.6% on last year. We continue to see strong growth in salaries across Victoria (+3.0%), Queensland (+3.0%) and NSW (+2.8%), with all states showing an increase.
Figure 1: National SEEK Job Ad growth by state (March 2018 vs. March 2019)
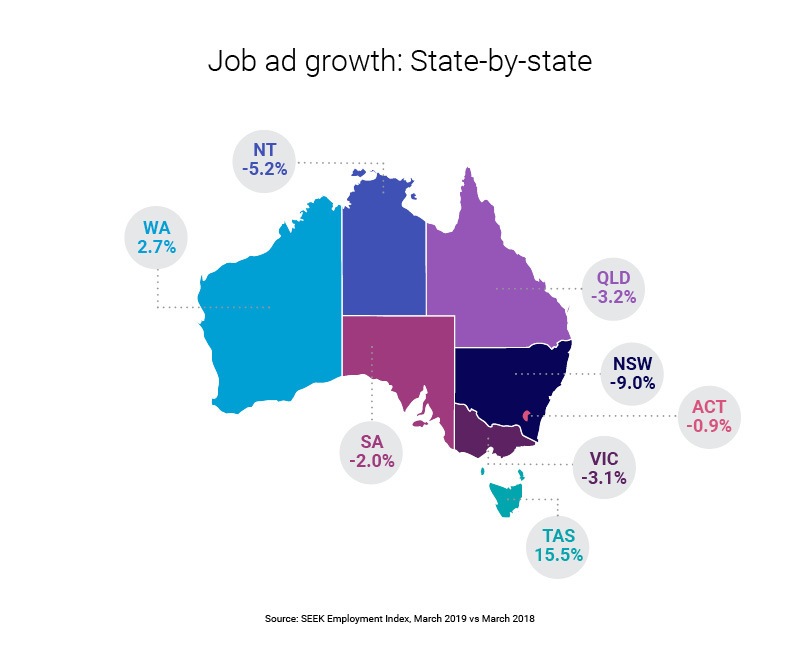
Figure 2: National SEEK Job Ad growth by industry (March 2018 vs. March 2019)
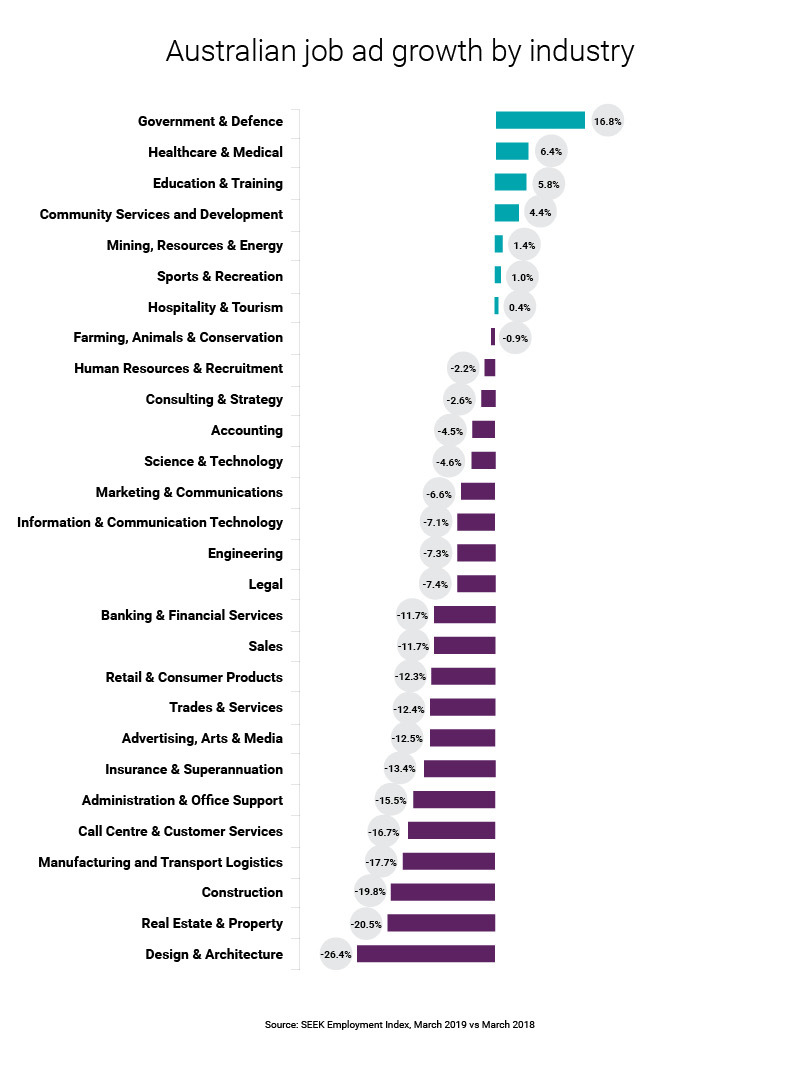
Table 2: Average Advertised Salaries Seasonally Adjusted
|
SALARIES SEASONALLY ADJUSTED |
|||||||||
|
MARCH 19 |
ACT |
NSW |
NT |
SA |
TAS |
VIC |
WA |
QLD |
AUS |
|
% increase |
2.3% |
2.8% |
0.4% |
1.8% |
4.8% |
3.0% |
2.7% |
3.0% |
2.6% |
|
avg. $ |
$89,320 |
$89,240 |
$86,423 |
$80,888 |
$77,719 |
$86,681 |
$89,956 |
$84,442 |
$87,248 |
—END—

