SEEK Employment Report - November 2023
- Job ads declined 4.3% in November.
- Job ad volumes are 13.6% higher than November 2019.
- Applications per job ad rose 2.9% from the month prior..
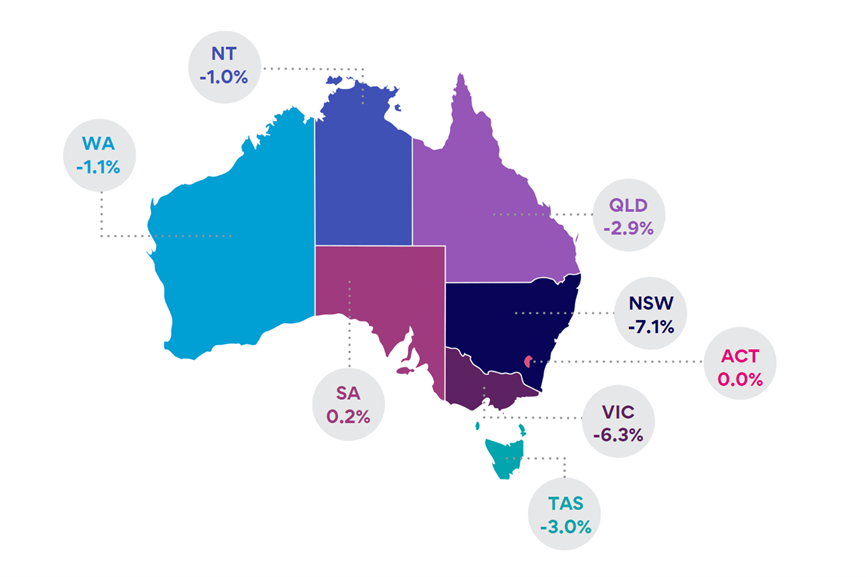
- Apart from South Australia (0.2%), job ads fell month-on-month (m/m) in all states as well as the Northern Territory.
- New South Wales (-7.1%) dropped the most, followed by Victoria (-6.3%).
- Every industry, aside from Insurance & Superannuation (1.6%), recorded a m/m decline in job ads.
- Consulting & Strategy had the biggest fall in November (-18.7%), followed by Retail & Consumer Products (-7.9%).
*Applications per job ad are recorded with a one-month lag. Data shown in this report refers to October data.
NATIONAL INSIGHTS
Job ad volumes fell 4.3% in November. They are now 20.2% lower year-on-year (y/y) but 13.6% higher compared to November 2019.
The decline was due to drops in ad volumes in all but one industry, Insurance & Superannuation (-1.6%), and in most states and the Northern Territory.
Due, in part, to the falling job ad numbers, applications per job ad continue to grow, rising 2.9% in October, and in almost every industry. Levels are now 82.8% higher y/y and are on par with October 2019.
Figure 1: National SEEK job ad percentage change m/m November 2022 to November 2023
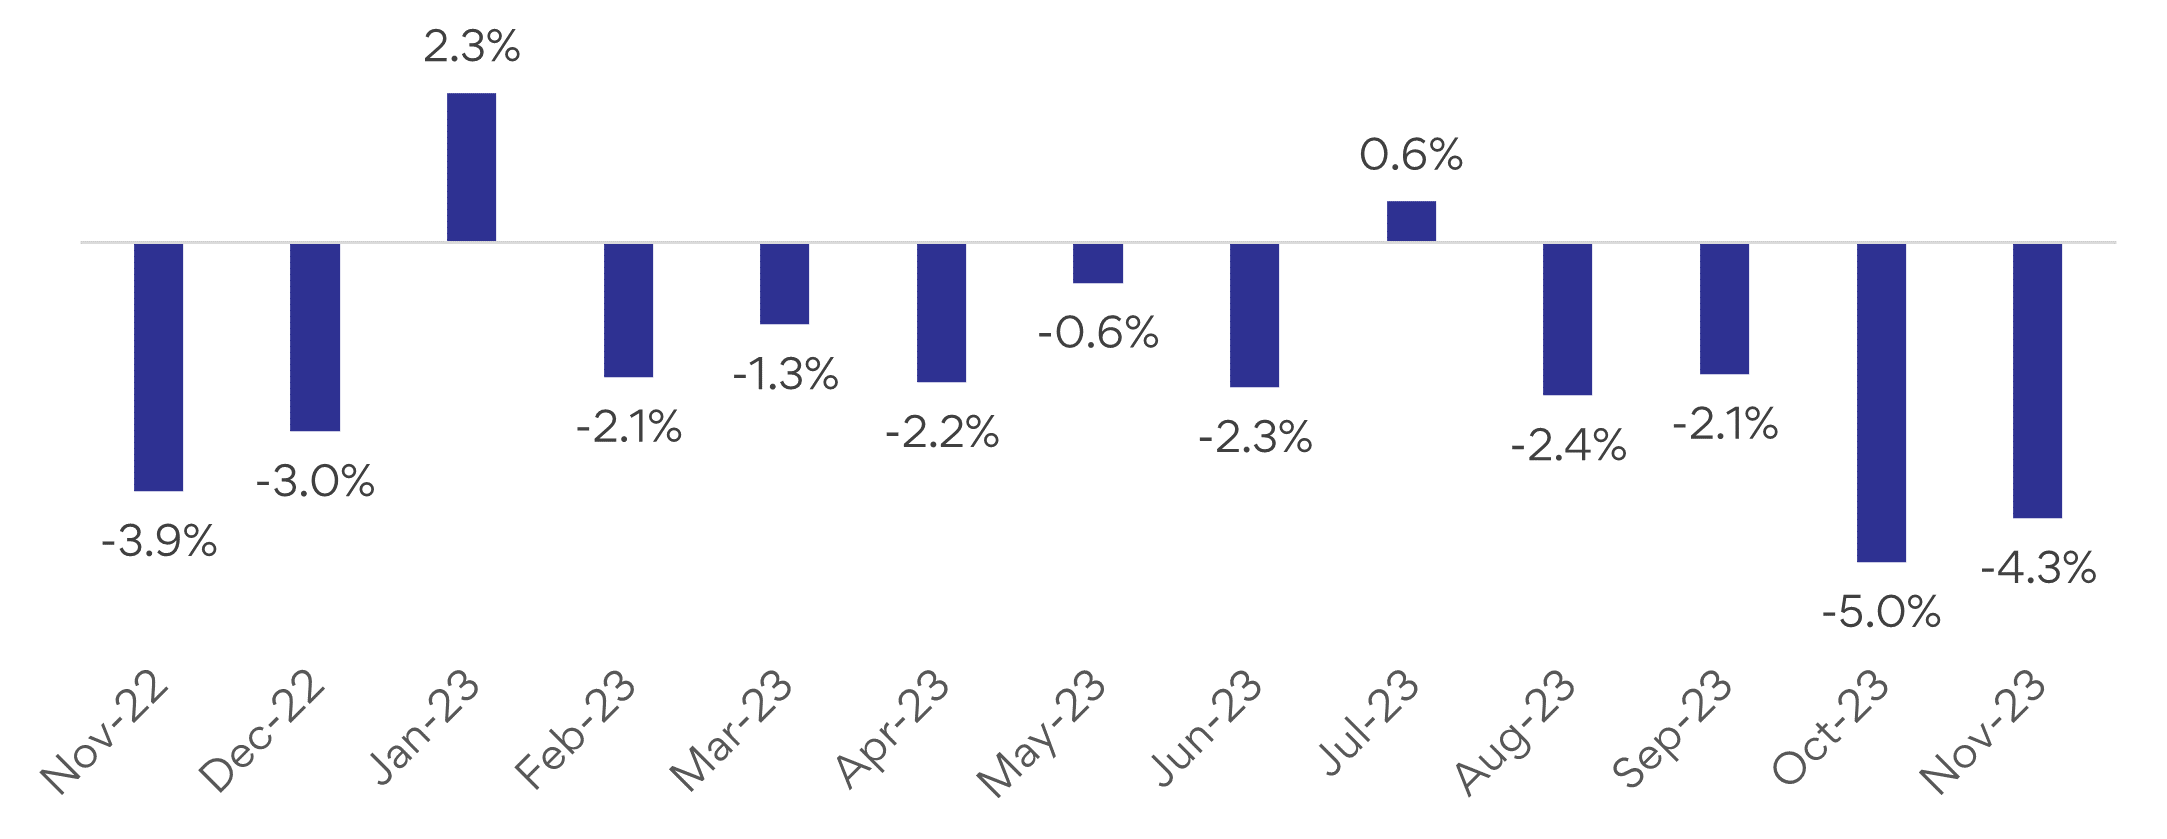
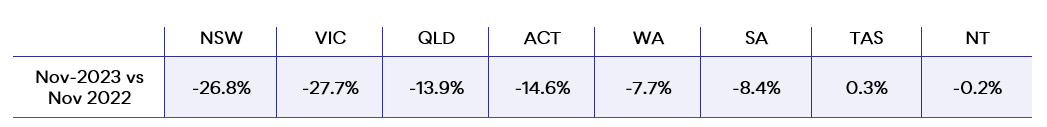
Figure 2: National, state and territory and metro/ regional job ad growth/decline comparing November 2023 to: i) October 2023 (m/m), and below ii) November 2022 (y/y).
STATE & TERRITORY INSIGHTS
Ad volumes fell in most states and in the Northern Territory in November. A marginal rise in South Australia (0.2%) and no change m/m in the Australian Capital Territory were the only exceptions.
New South Wales led the monthly fall in job ads, down 7.1%, the largest decline for the state in over two years. Aside from Insurance & Superannuation, which rose 5.8%, every other industry in New South Wales recorded falling job ad numbers.
In Victoria, relatively large drops in job ads in some large industries led to the state recording the second largest monthly drop in volumes: including Real Estate & Property (-14.0%), Retail & Consumer Products (-13.0%) and Sales (-11.9%).
Applications per job ad rose from the month prior in Victoria (7%), New South Wales (4%) and the Northern Territory (3%). Everywhere else, application levels dropped.
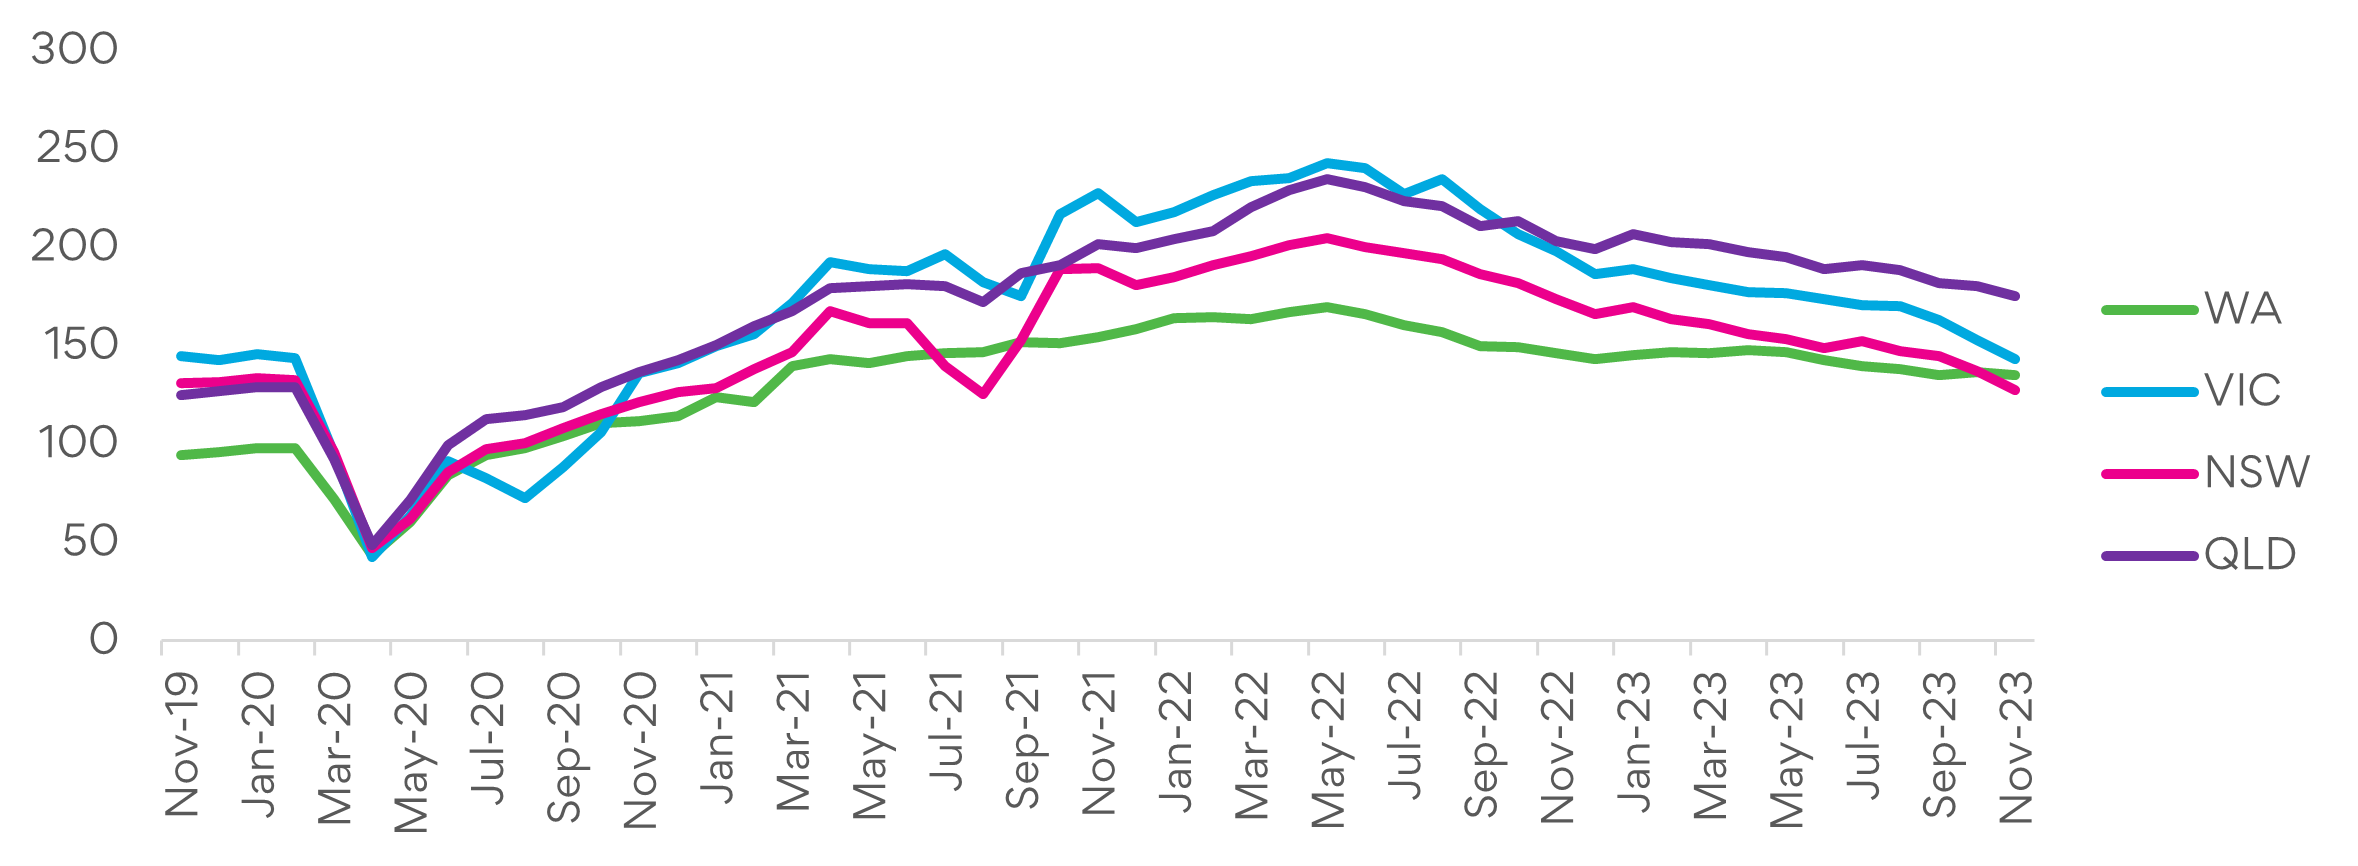
Figure 3: Major state job ad trends: November 2019 to November 2023
Index: 100 = 2013 avg
INDUSTRY INSIGHTS
Insurance & Superannuation was the only industry where job ad volumes increased in November, increasing for the first time since July. All other industries fell m/m, with the overall decline led by the largest industries by ad volume; Trades & Services (-4.6%), Healthcare & Medical (-3.8%) and Manufacturing, Transport & Logistics (-5.6%).
Applications per job ad rose from the month prior in most industries, the greatest being Retail & Consumer Products (11%), though not in some key disciplines with notable talent shortages, such Education & Training (-4%) and Healthcare & Medical (-2%).
When compared to pre-pandemic, it’s clear that the greatest change in job ads has occurred in Professional Services, with Information & Communication Technologies (-42.0%) and Banking & Financial Services (-40.4%) down significantly compared to November 2019.
Job ads in all other sectors are now higher than they were in 2019, particularly in the Public Sector (43.0%) and Industrial Sector (41.6%).
Table 1: Job ad growth by Sector November 2023 v November 2019.
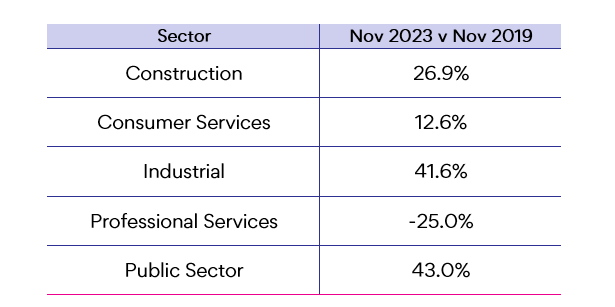
Figure 4: National SEEK Job Ad percentage change by industry (October 2023 vs November 2023) – Ordered by job ad volume

-ENDS-

